Skip to main content

Case studiesLive implementation

Consumer-Ready Fintech Integration

Embed stunning, minimalist charts directly into your banking or wealth management app. Designed for simplicity, our touch-first, lightweight charts provide a flawless mobile experience for retail investors.

Open the consumer demo

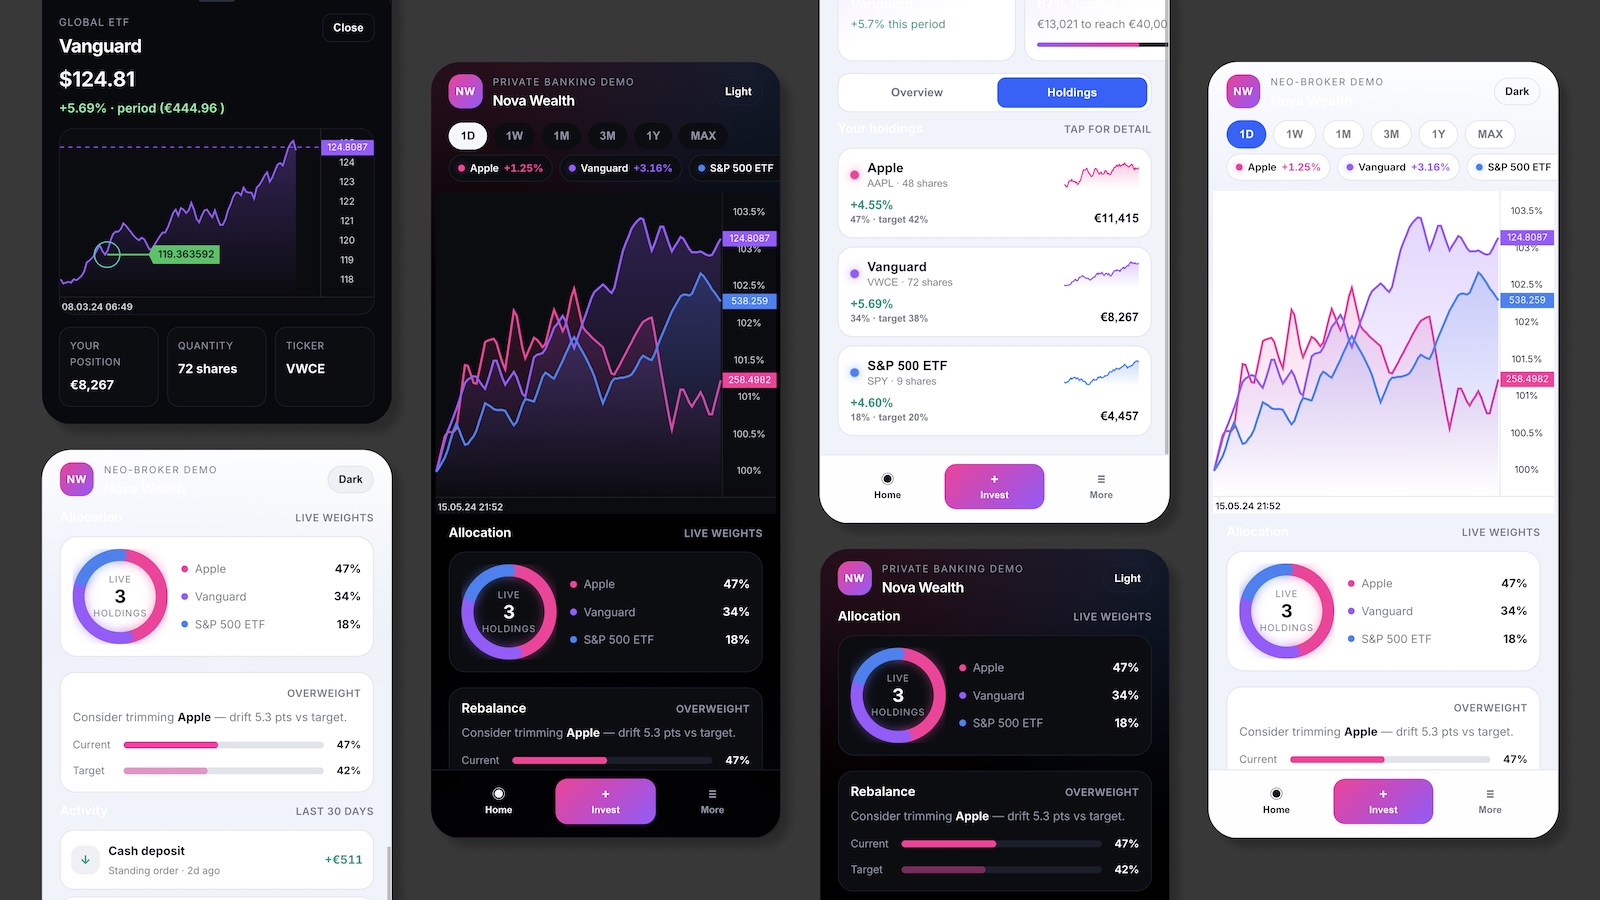
Full-screen wealth app — compare chart, allocation ring, watchlist sparklines. Also try the light banking route at /starters/fintech-integration/app-bank.

Open demo
Nova Wealth consumer fintech app with portfolio charts in light and dark themes

Stack

  • React
  • Core chart runtime
  • Multi-instrument compare
  • Touch-first mobile shell

Highlights

  • Download ZIP — Vite + React wealth starter with equity CSV fixtures
  • Crypto / Equities toggle in the live consumer demo
  • Portfolio from positions × price + cash row
  • For developers section with snippets and run locally steps

For developers

This page is your starting point: try the consumer demo, download a small React project, run it on your machine, then change whatever you want. Equities use static CSV fixtures; the live demo also supports a Crypto toggle with Binance data.

Get started in 5 steps

New to React or embedding charts in a banking app? Follow this path once. After that, extend the shell with your data feed and product chrome.

  1. See the finished app

    Open the consumer demo in another tab. This is what you are building — portfolio hero, compare chart, holdings, and asset detail. No install yet.

  2. Download the starter project

    Scroll to Starter code below and click Download ZIP. You get a ready-made Vite + React project with equity CSV fixtures — no need to clone this docs repo.

  3. Install dependencies

    Unzip the folder, cd into it, and run npm install. You need Node.js 18+.

  4. Run it locally

    Run npm run dev. Open the local URL (usually http://localhost:5173). The compare chart loads AAPL / VWCE / SPY from public/data/fintech-equity/.

  5. Start changing things

    Open src/App.tsx in your editor. Tweak colors, symbols, or portfolio layout — save and the page updates. Check snippets/ for chart setup, portfolio model, and shell components.

Prefer the browser? Use StackBlitz below — same workflow, no unzip step.

What already works vs what you add later

The starter is a consumer wealth UI with chart runtime and static equity fixtures. Toggle Crypto in the live demo for live Binance data — wire your own feed when you go to production.

In the starter ZIP

Works as soon as you run the project

No API keys for equities — CSV files ship in the zip under public/data/.

  • Multi-asset compare chart (% axis)
  • Portfolio value from positions × price
  • Cash + invested breakdown
  • Equity CSV fixtures (AAPL, VWCE, SPY)
  • Holdings list and allocation ring pattern
Multi-instrument charts →
Demo chrome

Product polish — replace with your brand

Decorative UI that shows layout patterns retail users expect.

  • Mock user name and savings goal
  • Watchlist radar cards
  • Bottom navigation (decorative)

Starter code

Download a zip, or copy a snippet into your own app. The zip includes src/App.tsx, src/equityDataLoader.ts, CSV fixtures in public/data/fintech-equity/, and extra examples in snippets/.

Pick one example to view or copy:

Smallest working compare chart — good first file to read.

import { useEffect, useRef } from "react";
import { createChart, type ChartInstance } from "@efixdata/exeria-chart";
import { loadEquityCandles } from "./equityDataLoader";

const DAILY_INTERVAL = { symbol: "1d", milis: 86_400_000 };

const ASSETS = [
  { id: "aapl", symbol: "AAPL", label: "Apple", color: "#FF2D9A" },
  { id: "vwce", symbol: "VWCE", label: "Vanguard", color: "#9B59FF" },
  { id: "spy", symbol: "SPY", label: "S&P 500 ETF", color: "#3B82F6" },
];

export default function App() {
  const containerRef = useRef<HTMLDivElement | null>(null);
  const chartRef = useRef<ChartInstance | null>(null);

  useEffect(() => {
    const container = containerRef.current;
    if (!container) return;

    const chart = createChart({
      container,
      instrument: { symbol: ASSETS[0].symbol, description: ASSETS[0].label },
      themeVariant: "dark",
    });

    chartRef.current = chart;
    chart.init();
    chart.setMainDrawMode("Line");
    chart.setValueAxisMode("%");

    void (async () => {
      const candles = await loadEquityCandles(ASSETS[0].symbol, "1m");
      await chart.setMainSeriesData(candles, DAILY_INTERVAL);
      chart.applyChartAppearanceSettings({
        ...chart.getChartAppearanceSettings(),
        backgroundColor: "#000000",
        gridVisible: false,
        chartLineFillVisible: true,
        chartLineFillMode: "gradient",
      });
      chart.render();
    })();

    return () => chart.destroy();
  }, []);

  return (
    <main style={{ minHeight: "100vh", background: "#000" }}>
      <div ref={containerRef} style={{ width: "100%", height: "min(56vh, 420px)" }} />
    </main>
  );
}

Commands to run in your terminal

# After downloading and unzipping the starter from /starters/fintech-integration:

cd exeria-fintech-wealth
npm install
npm run dev

# Open the URL printed in the terminal (usually http://localhost:5173).
# Edit src/App.tsx — save and the browser refreshes.

# Equity CSV fixtures are in public/data/fintech-equity/
# Swap AAPL.csv / VWCE.csv / SPY.csv for your own historical data.

# ── Starting from scratch instead? ──
# npm create vite@latest my-wealth-app -- --template react-ts
# cd my-wealth-app
# npm install @efixdata/exeria-chart
# Copy snippets/ from the zip, then: npm run dev

Open the consumer demo or light banking demo, then scroll to For developers to download the ZIP or copy snippets. More recipes in the tutorials.