Works after npm run dev
No API keys. JSON files ship in src/data/.
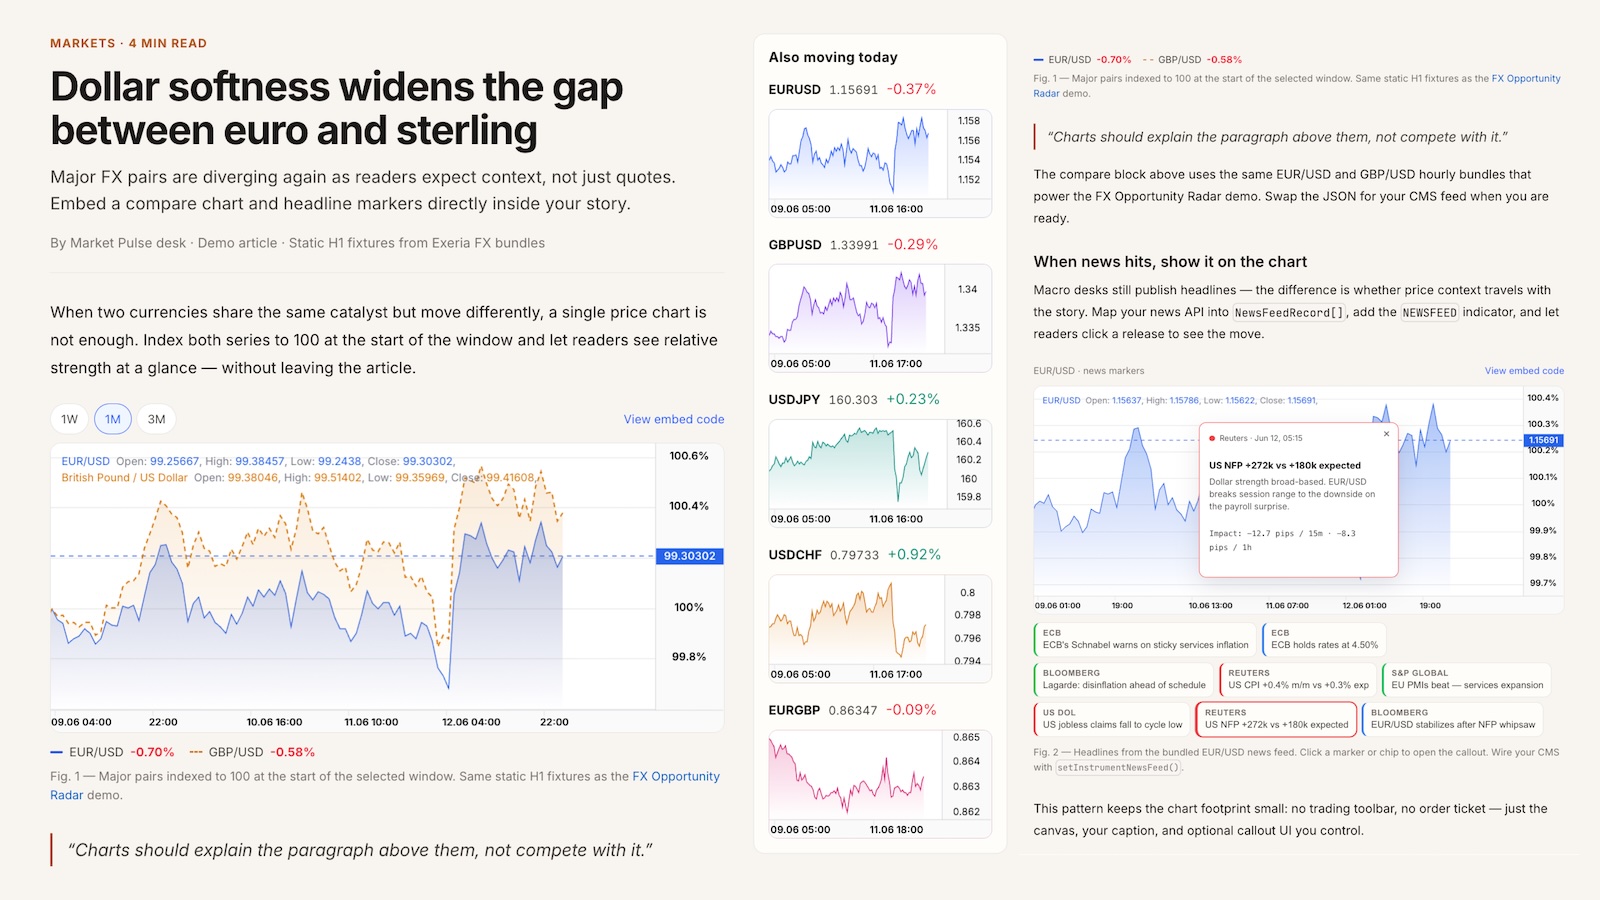
- Compare chart (EUR/USD vs GBP/USD, indexed to 100)
- News markers on EUR/USD (NEWSFEED script)
- Static H1 candle JSON — works offline
- Vanilla embed snippets (no React required)
Case studiesLive implementation
An editorial article layout you can run locally in minutes: compare chart, news markers on the canvas, and copy-paste embeds for your CMS. Download the zip, edit React files, and drop charts into your newsroom template.
Try the finished article first — compare chart, EUR/USD news dots, sidebar sparklines. Static FX fixtures; no API keys to start.
This page is your starting point: try the article demo, download a small React project, run it locally, then drop charts into your CMS. You do not need the whole Exeria codebase — follow the steps below and edit one file at a time (perfect for vibe coding in Cursor).
New to chart embeds or React? Follow this once. After that, paste snippets into your newsroom stack and let your editor help with the rest.
Open the live article demo in another tab — compare chart, news markers, editorial layout. No install yet.
Scroll to Starter code below and click Download ZIP. You get a Vite + React article with sample FX JSON — no need to clone this docs repo.
Unzip the folder, open Terminal (Mac) or PowerShell (Windows), cd into it, run npm install. You need Node.js 18+.
Run npm run dev and open the local URL (usually http://localhost:5173). You should see the article with two working charts.
Edit src/App.tsx in Cursor or VS Code — change the headline, add a paragraph, tweak chart height. Swap src/data/*.json when you wire your CMS. Extra examples live in snippets/.
Prefer the browser? Use StackBlitz below — blank Vite template, then paste a snippet.
The starter is a minimal article + charts app with bundled demo data. The live docs demo adds extra editorial polish you can copy when you are ready.
No API keys. JSON files ship in src/data/.
Open the live app to see patterns you can borrow — not all are in the ZIP.
Replace fixtures with your pipeline and embed in your CMS template.
Download a zip with sample FX JSON, or copy a snippet into your own app. The zip includes src/App.tsx plus smaller examples in snippets/.
Pick one example to view or copy:
Smallest possible chart — one div, one line series.
// Smallest embed — one div, one FX line chart.
// Good first file: paste into any Vite/React/Next page.

import { createChart } from "@efixdata/exeria-chart";
import eurUsdH1 from "./data/eur-usd-h1.json";

const container = document.getElementById("article-chart");
if (!container) throw new Error("Missing #article-chart");

const chart = createChart({ container });
chart.init();

const candles = eurUsdH1.candles.slice(-168); // last week of H1 bars
await chart.setMainSeriesData(candles, { symbol: "1h", milis: 3_600_000 });
chart.setMainDrawMode("Line");
chart.fit();
chart.moveToEnd();
chart.render();# After downloading and unzipping the starter from this page: cd exeria-market-news # or whatever you named the folder npm install npm run dev # Open the URL printed in the terminal (usually http://localhost:5173). # Edit src/App.tsx — save and the browser refreshes. # ── Starting from scratch instead? ── # npm create vite@latest my-market-article -- --template react-ts # cd my-market-article # npm install @efixdata/exeria-chart # Copy public/data/*.json from the zip, paste a snippet below into src/App.tsx # npm run dev