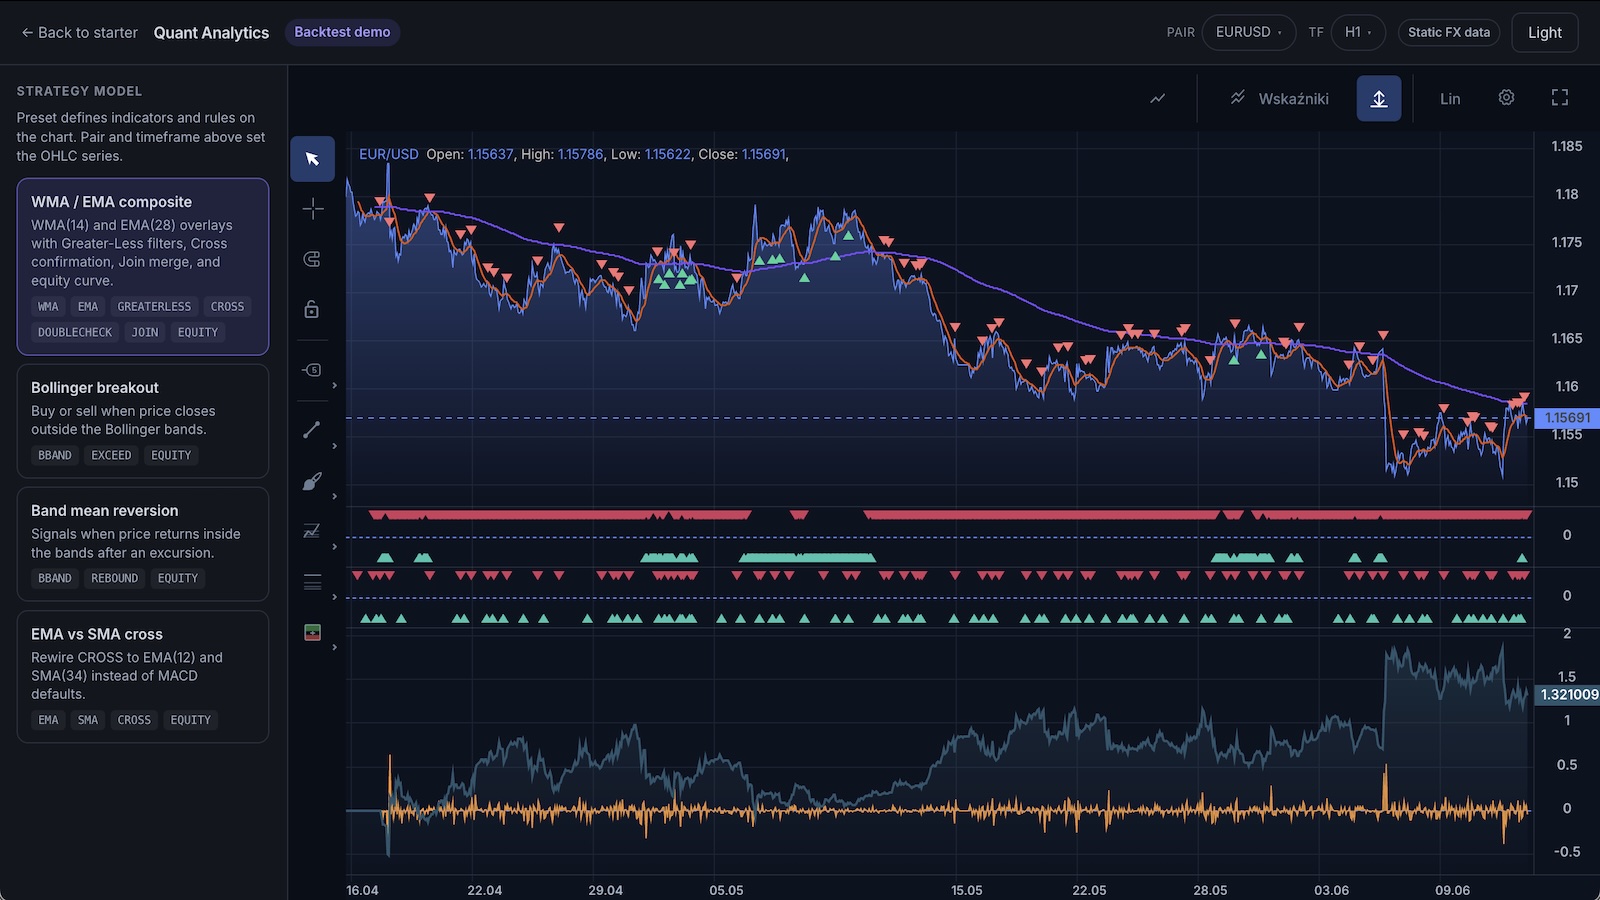
A backtest workbench you can run locally in minutes: strategy presets, buy/sell markers, indicator panes, and an equity curve. Download the zip, edit React files, and grow it into your own analytics product.
Open the live dashboard
Try the finished UI first — same layout you get in the downloadable starter. Strategies use bundled FX data; no API keys to start.
This page is your starting point: try the demo, download a small React project, run it on your machine, then change whatever you want. You do not need to understand the whole codebase on day one — follow the steps below and edit one file at a time.
Get started in 5 steps
New to React or charting? Follow this path once. After that, vibe-code whatever you want on top.
1
See the finished app
Open the live dashboard in another tab. Strategy presets, buy/sell markers, indicator panes, and an equity curve — no install yet.
2
Download the starter project
Scroll to Starter code below and click Download ZIP. You get a ready-made Vite + React project with bundled EUR/USD candles — no need to clone this docs repo.
3
Install dependencies
Unzip the folder, open your terminal app (Terminal on Mac, PowerShell on Windows), cd into the folder, and run npm install. You need Node.js 18+.
4
Run it locally
Run npm run dev. Your browser will show a local URL (usually http://localhost:5173) — open it. The chart loads EUR/USD H1 candles from public/data/eur-usd-h1.json and wires the default WMA/EMA composite strategy.
5
Start changing things
Open src/App.tsx in Cursor, VS Code, or any editor. Tweak indicator periods, swap presets, or add your own scripts — save the file and the page updates automatically. The snippets/ folder has copy-paste examples for Bollinger breakout, mean reversion, and equity curve wiring.
Prefer the browser? Use StackBlitz below — same workflow, no unzip step.
What already works vs what you add later
The starter is a real chart UI with bundled FX candles and built-in strategy scripts. Preset rankings and equity curves are demo backtests on purpose — so you can experiment safely before wiring your data and risk engine.
Works out of the box
Runs as soon as you unzip and npm install
No API keys. Candles ship inside the zip; indicators wire programmatically.
FX chart with ChartUI toolbar
Bundled EUR/USD H1 candles (static JSON, no API keys)
Download a zip, or copy a snippet into your own app. The zip includes src/App.tsx, strategy wiring in src/mountQuantDashboard.ts, bundled EUR/USD candles in public/data/, and extra examples in snippets/.
# After downloading and unzipping the starter from this page:

cd exeria-quant-analytics   # or whatever you named the folder
npm install
npm run dev

# Open the URL printed in the terminal (usually http://localhost:5173).
# Edit src/App.tsx — save and the browser refreshes.

# ── Starting from scratch instead? ──
# npm create vite@latest my-quant-dashboard -- --template react-ts
# cd my-quant-dashboard
# npm install @efixdata/exeria-chart @efixdata/exeria-chart-ui-react
# Paste a snippet from the starter page into src/App.tsx, then: npm run dev
Scroll to For developers to download the ZIP or copy snippets, then wire your data feed and custom strategies when you are ready. More recipes in the tutorials.